Main Street indicators show a slowdown in the holiday season?
Economic indicators and recent interest rate hikes have sent mixed messages about near-term expectations for inflation and the likelihood of a recession.
Continued slowdowns in the number of hours worked and the number of employees working at small businesses diverged from previous years, likely due to lower vacation-related spending.
Over the past quarter, interest rate hikes and economic indicators on inflation and employment have led to much speculation that a recession is on the way in 2023. To understand the impact of the broader economic environment on small businesses and their employees in 2022 during the holiday season, we analyzed behavioral data from over two million employees working in more than one hundred thousand SMBs.
Summary of Findings: High frequency timesheet data from Homebase indicates a continued slowdown in hours worked and employees working across most industries and major metropolitan areas.
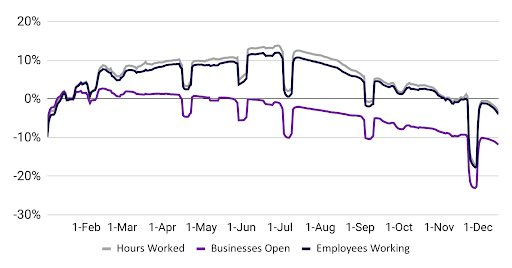
Our main high street health metrics – hours worked and employees working – continued to decline month-over-month in December. The number of active employees fell 3.5 percentage points on a 7-day moving average in December compared to November. The decline in December was more pronounced than that seen at the same time in recent years. Most industry categories showed a decline in the number of employees working in mid-December compared to mid-November, more than in the past. The declines were steeper than the corresponding period in 2019, with hospitality (-7.0%) and caregiving (-4.3%) showing the largest declines. Entertainment, although weaker than its comparative level in 2019, bucked the trend with a monthly increase (+0.3% compared to November). Hours worked have seen a steady decline in the 5 major metropolitan areas. These declines have been a consistent trend over the past two quarters, although Chicago and Los Angeles saw the largest declines from a year ago.The percentage of employees working continued to decline after the Thanksgiving holiday, down 3.5 percentage points from the previous month. This downward trend is slightly more pronounced than that observed at the same time in previous years.
Employees working (7-day moving average; relative to January of current year)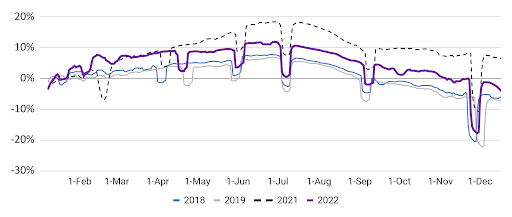
Most industries, with the exception of entertainment, saw a steep decline in the number of employees working in the week leading up to the 2022 holidays. Beauty & Wellness and Grooming fell furthest below from their corresponding 2019 levels, unlike our November data.
Percentage change in the number of employees working (Relative to January 2022 baseline using 7-day moving average)1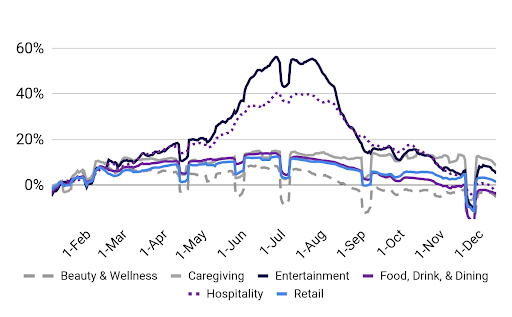

Economic indicators and recent interest rate hikes have sent mixed messages about near-term expectations for inflation and the likelihood of a recession.
Continued slowdowns in the number of hours worked and the number of employees working at small businesses diverged from previous years, likely due to lower vacation-related spending.
Over the past quarter, interest rate hikes and economic indicators on inflation and employment have led to much speculation that a recession is on the way in 2023. To understand the impact of the broader economic environment on small businesses and their employees in 2022 during the holiday season, we analyzed behavioral data from over two million employees working in more than one hundred thousand SMBs.
Summary of Findings: High frequency timesheet data from Homebase indicates a continued slowdown in hours worked and employees working across most industries and major metropolitan areas.
Our main high street health metrics – hours worked and employees working – continued to decline month-over-month in December. The number of active employees fell 3.5 percentage points on a 7-day moving average in December compared to November. The decline in December was more pronounced than that seen at the same time in recent years. Most industry categories showed a decline in the number of employees working in mid-December compared to mid-November, more than in the past. The declines were steeper than the corresponding period in 2019, with hospitality (-7.0%) and caregiving (-4.3%) showing the largest declines. Entertainment, although weaker than its comparative level in 2019, bucked the trend with a monthly increase (+0.3% compared to November). Hours worked have seen a steady decline in the 5 major metropolitan areas. These declines have been a consistent trend over the past two quarters, although Chicago and Los Angeles saw the largest declines from a year ago.The percentage of employees working continued to decline after the Thanksgiving holiday, down 3.5 percentage points from the previous month. This downward trend is slightly more pronounced than that observed at the same time in previous years.
Employees working (7-day moving average; relative to January of current year)
Most industries, with the exception of entertainment, saw a steep decline in the number of employees working in the week leading up to the 2022 holidays. Beauty & Wellness and Grooming fell furthest below from their corresponding 2019 levels, unlike our November data.
Percentage change in the number of employees working (Relative to January 2022 baseline using 7-day moving average)1
What's Your Reaction?