Improve your data analysis with the Advanced Graph Widget for Arduino Cloud
We are excited to announce the release of our latest Arduino Cloud feature, the Advanced Chart widget! This new and improved widget is a significant upgrade to our old chart widget, offering more customization options and features that will make viewing and analyzing your device data easier than ever. In this blog post, we'll explore the benefits of the advanced chart widget, how to use it, and how you can take advantage of this new feature.
Your Devices Always Monitored with Arduino Cloud DashboardsBut, what is the Arduino Cloud? Arduino Cloud is an integrated platform that provides an easy and efficient way to develop, deploy and manage IoT devices. Supporting a wide list of hardware, including Arduino boards, ESP32 and ESP8266-based boards, the platform enables makers, IoT enthusiasts and professionals to create connected projects effortlessly. What sets Arduino Cloud apart is its user-friendly and intuitive interface that abstracts complex tasks, making it accessible to users who are unfamiliar with coding.
Users can create dashboards from a rich palette of widgets, which include switches, buttons, color pickers, states, gauges, maps and, of course, a chart widget where you can plot the time evolution of a device variable.
Benefits of the Advanced Chart WidgetThe Advanced Graph Widget is a powerful tool to monitor and analyze device data. Its ability to display multiple variables in a single graph allows for easy comparison of data points, making it particularly useful for tracking multiple data streams such as temperature and humidity in a greenhouse or energy use in a building.
Additionally, the advanced chart widget is highly customizable, allowing you to tailor it to your specific needs. You can adjust the colors and types of the graphs, the labels on the axes and the legend to make it easier to read and interpret the data.
One of the limitations of the Standard Chart widget is its inability to display data over custom time periods. It only offers four predefined time ranges: real time, 1 hour, 1 day and 15 days. However, the Advanced Chart widget provides the option to select an arbitrary time period, allowing users to access their device's complete data history, based on their plan's retention period. This is a crucial benefit for users who need to track long-term trends and patterns, allowing them to make informed decisions based on their device's comprehensive data history.

The Advanced Chart widget offers a wide range of use cases, from monitoring environmental conditions to tracking energy usage. For example, you can use the widget to monitor temperature and humidity in a greenhouse to ensure optimal growing conditions for your plants. Alternatively, you can use it to track energy consumption in a building and identify areas where you can reduce your energy consumption. With the ability to display multiple variables in a single graph, the possibilities are endless!
How to use the advanced chart widgetUsing the Advanced Chart Widget is easy!
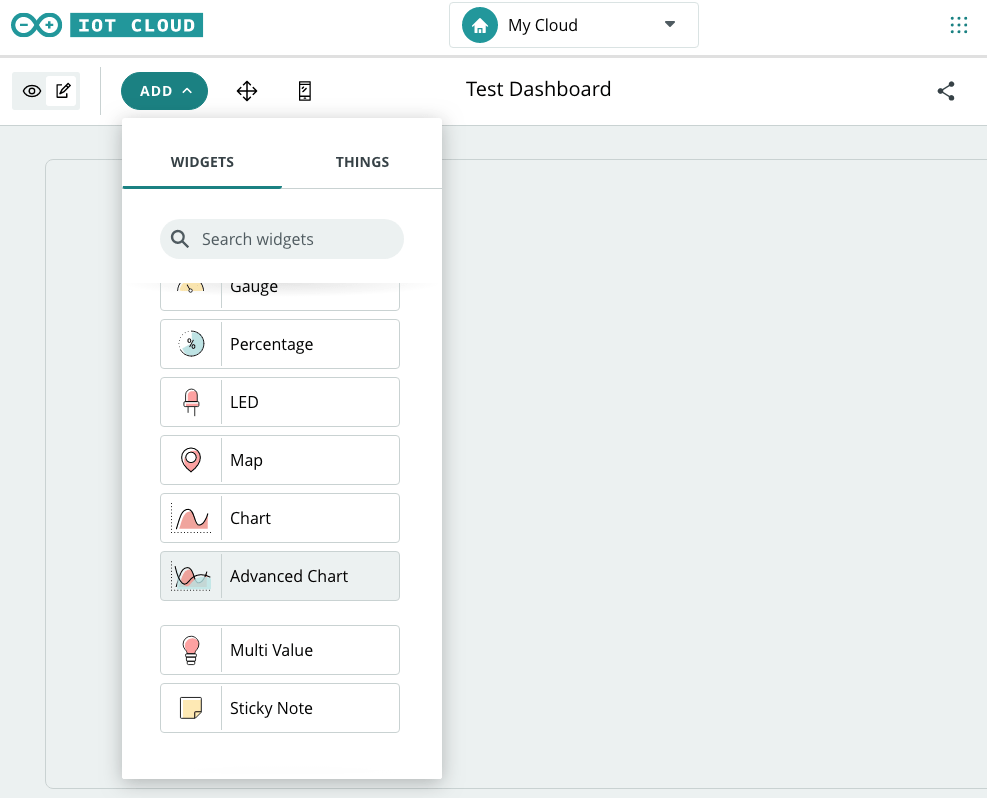
Create your dashboard as usual, then click "Add widget". Select "Advanced Chart" from the list of available widgets.

Customize your chart by selecting the variables you want to display, choosing the chart type and color for each variable, and setting up the Y axes with the labels you want to use. You can also choose whether or not to display a legend for your chart.

Once you've customized your chart, you can adjust its size and location on your dashboard. Remember that you can customize separate dashboard views for browsers or the mobile app.
Last but not least, an improved percentage widget!Good things come in pairs and we are thrilled to announce the release of our new and improved percentage widget. This latest update allows...
We are excited to announce the release of our latest Arduino Cloud feature, the Advanced Chart widget! This new and improved widget is a significant upgrade to our old chart widget, offering more customization options and features that will make viewing and analyzing your device data easier than ever. In this blog post, we'll explore the benefits of the advanced chart widget, how to use it, and how you can take advantage of this new feature.
Your Devices Always Monitored with Arduino Cloud DashboardsBut, what is the Arduino Cloud? Arduino Cloud is an integrated platform that provides an easy and efficient way to develop, deploy and manage IoT devices. Supporting a wide list of hardware, including Arduino boards, ESP32 and ESP8266-based boards, the platform enables makers, IoT enthusiasts and professionals to create connected projects effortlessly. What sets Arduino Cloud apart is its user-friendly and intuitive interface that abstracts complex tasks, making it accessible to users who are unfamiliar with coding.
Users can create dashboards from a rich palette of widgets, which include switches, buttons, color pickers, states, gauges, maps and, of course, a chart widget where you can plot the time evolution of a device variable.
Benefits of the Advanced Chart WidgetThe Advanced Graph Widget is a powerful tool to monitor and analyze device data. Its ability to display multiple variables in a single graph allows for easy comparison of data points, making it particularly useful for tracking multiple data streams such as temperature and humidity in a greenhouse or energy use in a building.
Additionally, the advanced chart widget is highly customizable, allowing you to tailor it to your specific needs. You can adjust the colors and types of the graphs, the labels on the axes and the legend to make it easier to read and interpret the data.
One of the limitations of the Standard Chart widget is its inability to display data over custom time periods. It only offers four predefined time ranges: real time, 1 hour, 1 day and 15 days. However, the Advanced Chart widget provides the option to select an arbitrary time period, allowing users to access their device's complete data history, based on their plan's retention period. This is a crucial benefit for users who need to track long-term trends and patterns, allowing them to make informed decisions based on their device's comprehensive data history.
The Advanced Chart widget offers a wide range of use cases, from monitoring environmental conditions to tracking energy usage. For example, you can use the widget to monitor temperature and humidity in a greenhouse to ensure optimal growing conditions for your plants. Alternatively, you can use it to track energy consumption in a building and identify areas where you can reduce your energy consumption. With the ability to display multiple variables in a single graph, the possibilities are endless!
How to use the advanced chart widgetUsing the Advanced Chart Widget is easy!
Create your dashboard as usual, then click "Add widget". Select "Advanced Chart" from the list of available widgets.
Customize your chart by selecting the variables you want to display, choosing the chart type and color for each variable, and setting up the Y axes with the labels you want to use. You can also choose whether or not to display a legend for your chart.
Once you've customized your chart, you can adjust its size and location on your dashboard. Remember that you can customize separate dashboard views for browsers or the mobile app.
Last but not least, an improved percentage widget!Good things come in pairs and we are thrilled to announce the release of our new and improved percentage widget. This latest update allows...
What's Your Reaction?