How to Monitor a Raspberry Pi Remotely
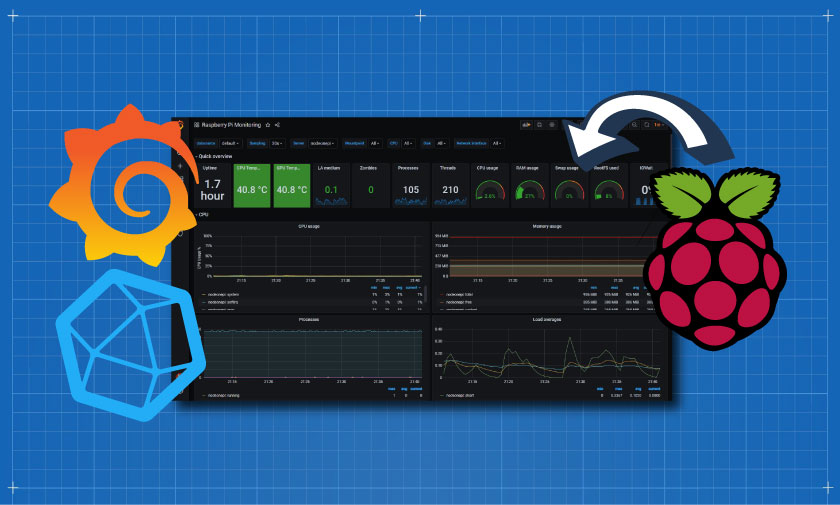
I'm working on a project that hosts a group of Raspberry Pi computers in several remote locations. I wanted to be able to monitor the “health” of hardware in those remote locations. The metrics I was hoping to capture are uptime, CPU times, CPU utilization, memory and disk utilization, etc. as you may have noticed, I also have a love/hate relationship with Grafana, which made it the only choice to display these metrics in a friendly way.
Preconditions:1 x VM running Ubuntu 20.04 - I tested using a Cloud Compute server on VULTR, but you can use any VM that is on the same network as the RPi.
1 x RPi – As long as the RPi is on the same network, everything is fine. I tested through a VPN and that also worked.
Software stack:Influxdb - As usual, the time series database.
Grafana – My favorite program for displaying this type of data.
Telegraf - A plugin server agent to collect and report hardware metrics such as CPU, Time, RAM, Storage, etc…
Install InfluxDb on VM/Host Install Grafana on VM/HostPLEASE READ: Now that Grafana and InfluxDb are installed on our host/server. We need to install Telegraf on the RPi whose metrics we want to retrieve. Don't worry, we'll come back and configure Grafana/InfluxDb shortly.
Install Telegraf on Raspberry Pi (RPi) Setup – Telegraf on RPi Telegraf.confPLEASE READ: Now that we've finished setting up the Raspberry Pi, it's up to the VM/Host to set up the influx and grafana.
Configuration – InfluxDB on VM/Host Setup – Grafana Navigate to your Grafana installation: http://
Login: default login is admin:admin
Please change username and password immediately.
The first step is to add the Influxdb data source:

The second step is to import the dashboard - We used this dashboard from the Grafana library:
https://grafana.com/grafana/dashboards/10578/reviews Props to Jorge
To import the dashboard, go to DASHBOARD > MANAGE > IMPORT
Insert 10578 in the field and click on "Load"

Then be sure to select the data source to associate with the dashboard.
I'm working on a project that hosts a group of Raspberry Pi computers in several remote locations. I wanted to be able to monitor the “health” of hardware in those remote locations. The metrics I was hoping to capture are uptime, CPU times, CPU utilization, memory and disk utilization, etc. as you may have noticed, I also have a love/hate relationship with Grafana, which made it the only choice to display these metrics in a friendly way.
Preconditions:1 x VM running Ubuntu 20.04 - I tested using a Cloud Compute server on VULTR, but you can use any VM that is on the same network as the RPi.
1 x RPi – As long as the RPi is on the same network, everything is fine. I tested through a VPN and that also worked.
Software stack:Influxdb - As usual, the time series database.
Grafana – My favorite program for displaying this type of data.
Telegraf - A plugin server agent to collect and report hardware metrics such as CPU, Time, RAM, Storage, etc…
Install InfluxDb on VM/Host Install Grafana on VM/HostPLEASE READ: Now that Grafana and InfluxDb are installed on our host/server. We need to install Telegraf on the RPi whose metrics we want to retrieve. Don't worry, we'll come back and configure Grafana/InfluxDb shortly.
Install Telegraf on Raspberry Pi (RPi) Setup – Telegraf on RPi Telegraf.confPLEASE READ: Now that we've finished setting up the Raspberry Pi, it's up to the VM/Host to set up the influx and grafana.
Configuration – InfluxDB on VM/Host Setup – Grafana Navigate to your Grafana installation: http://
Login: default login is admin:admin
Please change username and password immediately.
The first step is to add the Influxdb data source:
The second step is to import the dashboard - We used this dashboard from the Grafana library:
https://grafana.com/grafana/dashboards/10578/reviews Props to Jorge
To import the dashboard, go to DASHBOARD > MANAGE > IMPORT
Insert 10578 in the field and click on "Load"
Then be sure to select the data source to associate with the dashboard.
What's Your Reaction?